

The Data Acquisition & Analysis Program
Generatortech provides Windows-based programs that combines data acquisition with the display and analysis of rotor shorted turns. The system uses high-speed data acquisition hardware to record the flux probe waveforms and provides an oscilloscope-like display while recording data. The waveforms are continuously analyzed during testing and waveforms that optimize detection sensitivity in each rotor coil are automatically recorded.. The program identifies and labels the waveform features and measures the appropriate values to provide accurate estimates of turn shorts in each coil.
Ease of use was the most important guiding principle behind the design of the program. The program has two automatic recording modes that eliminate the need to attend to the equipment during testing periods. The portable system takes 10-15 minutes to setup. The Generatortech program is then started before the test period begins (unit startup or shutdown or before a large load swing) and the program will automatically record all the required waveforms.
Multiple generator units can be saved within the program. After the initial setup, the process of acquiring and saving data is reduced to a few simple steps:
1. Start the Generatortech program.
2. Select the unit to be tested from a list.
3. Select START!
4. Optimized waveforms will automatically be recorded as load changes on the generator.
Below are sample graphs using a 16 MWS, 0 MVAR load from a two-pole rotor with 6 coils/pole that show the variety of displays available when analyzing waveforms. This rotor had a single short in Coil 5-Pole A.

Raw Flux Probe Graph - shows the raw data recorded from the flux probe. This is a 110 MVA generator with a two-pole rotor, 6 coils/pole using 18 turns in Coil 1 and 20 turns in Coils 2-6. The winding has a single turn short in Coil 5A.
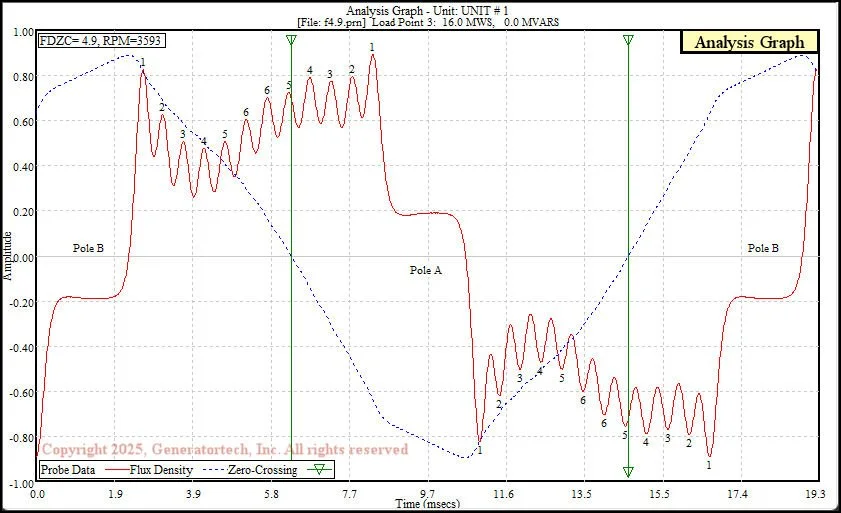
Analysis Graph - shows the raw data (red) with the flux density curve (dotted blue) overlaid. Each numbered peak correlates to a coil slot in the rotor body. The flux density zero-crossing (FDZC) position is marked with a green vertical line in all graphs other than the Raw Data Graph.
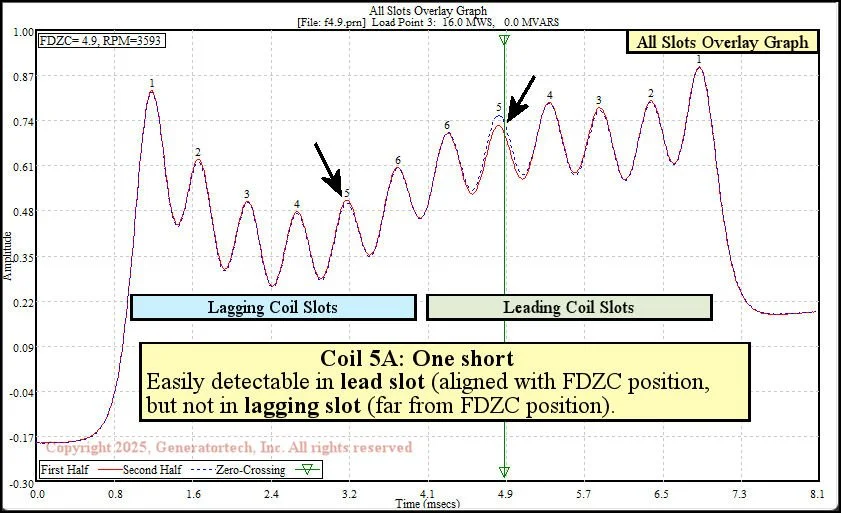
All Slots Overlay Graph - shows an overlay graph with both the leading and lagging coil slots. For a synchronous generator, the FDZC position will always be in the leading slot region, which means the lagging coil slots are far from the FDZC. As a result, turn short indications in the lagging slot region are normally not well resolved and false indications are much more common. For example, the Coil 5A turn short indication is clearly detectable in the leading slots peaks (close to the FDZC), but not in the lagging slot peaks of Coil 5. For this reason, we normally display turn shorts using the Lead Slots Overlay Graph.

Lead Slots Overlay Graph - shows an overlay of each pole’s leading slots. The short in Coil 5-Pole A (1 short with 20 total turns) is clearly displayed at this lower load whose FDZC position is well aligned with Coil 5. At higher loads, when the FDZC position is close to the smaller coils (Coils 1-3), the Coil 5A short is not detectable (see Lead Slots Overlay Graph animation in Overview of Shorted Turn Theory).

Summery Sheet Printout - shows four graphs, plus the Shorted Turn Data Table. The percentage decrease is printed for the smaller pole of each coil. A turn short indication is printed if its calculated magnitude exceeds the default threshold of 0.50 turn shorts. At higher loads, when the FDZC position is close to the smaller coils (Coils 1-3), the Coil 5A indications drops below the 0.50 threshold.