

Overview of Shorted Turn Theory & Flux Probe Testing
When current flows through a rotor winding, it creates a magnetic field around the rotor. For the large 2- and 4-pole round rotors being discussed here, the turns in the rotor winding are distributed in coil slots machined into the rotor body. A flux probe measures the magnetic field in close proximity to the rotor surface, allowing the contribution of each individual coil in the rotor winding to be determined. An analysis of a set of flux probe waveforms can detect the number of turns shorted out of each rotor coil.
The magnetic field produced by a coil is proportional to the field current times the number of active turns in the coil (amp-turns or magnetomotive force [MMF]). If a turn short is present, the number of active turns in the coil is reduced and the resulting field decrease can be calculated through an analysis of the flux probe waveform.
The figures below show an example of how a turn short is detected using flux probe data. The rotor cross-section shows a two-pole rotor from a 110-MVA generator with 6 coils/pole using 18 turns in Coil 1 and 20 turns in Coils 2-6. Each coil has two slots, with one slot leading and the other slot lagging the pole face in terms of the rotation direction. This rotor had a single turn short in Coil 5-Pole A (Coil 5A). Since a turn short bypasses an entire turn, it affects both the leading and lagging slots of that coil, so both slots of Coil 5A are colored in the diagram (NOTE: see Rotor Winding Description topic for an overview of rotor winding construction).
The annotated Analysis Graph below shows a waveform from this same rotor recorded at 48 MWS, 0 MVARS. The raw flux probe data (red) shows numbered peaks that correspond to each coil slot displayed in the cross-section. Pole A is, by definition, the pole whose leading coil slot peaks are positive-going. The flux density curve (dotted blue) shows the magnetic field strength around the rotor. The flux density zero-crossing (FDZC) position is marked with a vertical green line.
The FDZC position is important because the coil that aligns with the FDZC will have the best detection sensitivity for true turn shorts and the least sensitivity for false turn short indications (in this waveform, the FDZC position is closely aligned with Coil 3).
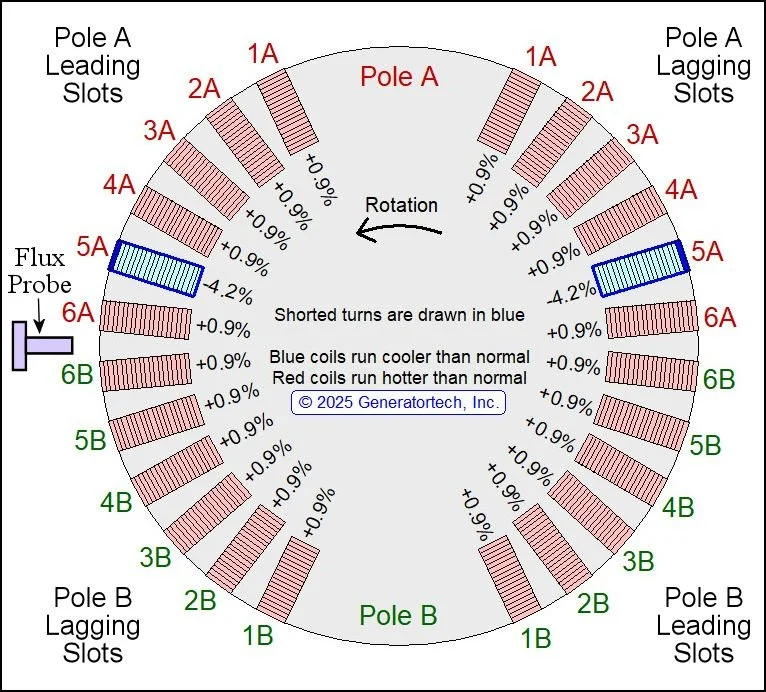
Rotor Cross-section - shows a two-pole rotor with 6 coils/pole and a single short in Coil 5-Pole A (Coil 5A, 20 total turns). The change in the heat produced by each coil due to that short is also displayed.
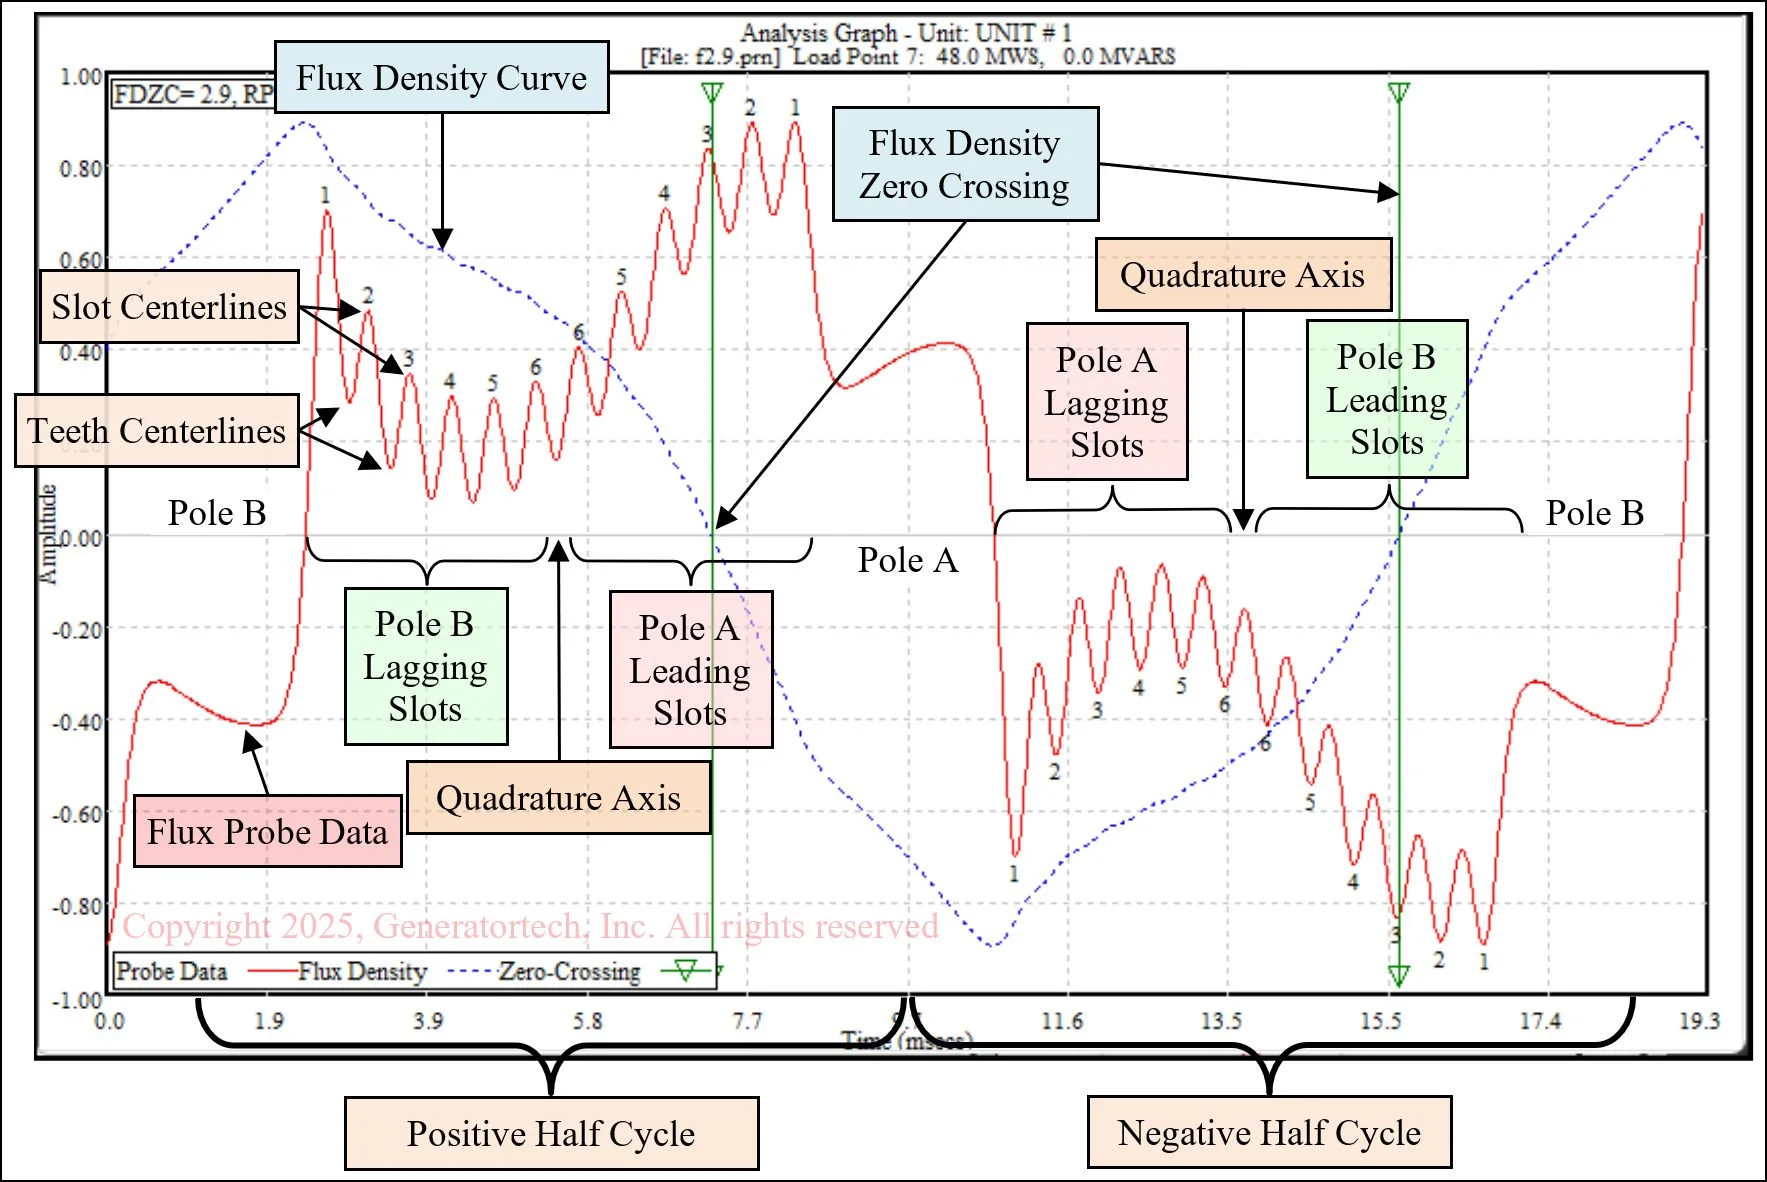
Analysis Graph - from a rotor with 6 coils/pole and a Coil 5A turn short. Labels on the graphs identify features of interest. Compare with the rotor cross-section to understand how the waveform ‘s peaks correlate with the coil slots.
True Turn Short Detection Sensitivity Varies with Load
In most cases, a turn short in a coil is not detectable over the entire load range. Due to magnetic saturation and modulation effects, indications for true turn shorts decrease as the FDZC moves further away from the affected coil. The sensitivity often decreases to a point where the short is not detectable if the FDZC is too far away.
False Turn Short Indications Vary with Load
False turn shorts are peak height differences that are not related to true shorts. These are normally due to modulation artifacts that grow larger as the FDZC position moves away from the affected coil, opposite the behavior of a true short.
If testing is only done at one load, then turn short indications in coils far from the FDZC position cannot be assigned as true or false. However, the trend in indications as load is changed makes the determination of true or false turn shorts quite straightforward.
To get the best detection sensitivity in all rotor coils, testing records a series of waveforms as the load on the unit is varied. Changes to both real power (MWS) and reactive power (MVARS) move the FDZC position of the waveform. An ideal test set would have waveforms with FDZC positions aligned with each coil in the rotor. For a real test, waveforms are selected and analyzed that have the closest FDZC position to each rotor coil.
To record data over a wide range of loads, flux probe testing during startups or shutdowns is ideal. The Generatortech software automatically records optimized waveforms for each rotor coil as load on the generator is changing, so the equipment can be setup before a startup or shutdown and be left to automatically record the necessary data. The startup or shutdown can be performed as is normally done by the plant.
If testing cannot be done during a startup or shutdown, then the test is done with the widest range of real power permitted. Reactive load changes at the minimum and maxim real loads can increase detection sensitivity in the smallest and largest rotor coils.
The animations below show a complete test of the same rotor shown above with a short in Coil 5A. The seven waveforms were recorded during a startup that reached full load. The Analysis Graph animation shows how FDZC moves to the right as the real load (MWS) increases from no-load to full-load To achieve alignment of the FDZC with Coil 1, negative reactive load (MVARS) was used at full real load (83 MWS, - 28 MVARS), The FDZC position is determined by the Rotor Power Angle, which is the angular separation between the north pole of the rotor and the north pole of the rotating stator field. The Analysis Graph animation includes the associated Rotor Power Angles.
The second animation shows the Lead Slot Overlay Graphs for the test. This graph type shows the turn short indications best since the FDZC is always in the leading slot regions for a generator putting out load. The Coil 5A short is best seen when the FDZC is closely aligned with that coil. At higher loads, the Coil 5A short was not detectable. The Trend Curve shows the calculated turn short indication for Coil 5A was maximized when the FDZC position was near alignment with the #5 coil slots. The practice of testing at just full load would miss the Coil 5A short.
Analysis Graph Animation - FDZC position (green line) moves to right toward the smaller coils (Coils 1 and 2) as real load increases. Reducing field current (negative MVARS) also moves the FDZC to the right. The FDZC position is determined by the Rotor Power Angle.
Lead Slot Overlay Graph Animation - a pole-to-pole comparison of peaks shows the Coil 5A short is only detectable at low loads (when FDZC position is close to alignment with the #5 coils). Testing at just full load would have missed this turn short.

Shorted Turn Indication Trend Curve - the indication for a true short will be optimized when the waveform’s FDZC position is closely aligned with that coil.